Trading Economics Features, How It Works | Pivlex
The trading economics platform lets its users examine and evaluate the several factors that affect the economic activities and consequences of different countries and regions. This post will tell you all the features this platform provides that you will not find anywhere on the internet.
An Overview of Trading Economics
It is basically a statistical website or a platform produced by IeconomicsInc in 2006 that is based in London, United Kingdom. This platform offers a wide range of economic and financial data, forecasts, and news on the economy and other related data about the trading markets of 196 countries. It helps a trader, investor, and an analyst to get the insights of trading. It is a valuable platform for making up-to-date decisions in financial markets.
Moreover, this platform caters to authentic information based on their official and different sources of third-party data providers, including the World Bank, the International Monetary Fund (IMF), government central banks, and national statistics bureaus. The data of this platform includes historical, delayed, and live quotes data, more than 20 million economic indicators, exchange rates, stock market indexes, government bond yields, and commodity prices. All of the information the platform offers is frequently checked and updated hourly.
However, on this platform, users can see all the indicators that show the historical series and graph for free. But if users want to download the data to compare them and see even more details and get notifications in real time then they must subscribe to a subscription plan.
Features of Trading Economics
The comprehensive financial data platform caters to incredible features for traders, policymakers, business owners, and investors who want real-time and detailed analysis of markets.
1. Finance Market Data
Traders and investors of financial tools meet and trade in financial markets. Trading economic software offers real-time and delayed quotes of various financial instruments. The website claims for the future cash flow of the below-mentioned source of trading.
- Equities like stocks signify a share of possession in a company.
- Currencies like the US Dollar signify a medium of exchange and a store of value.
- Commodities like gold signify a physical good that has instructive value.
- Fixed income, like bonds, signifies a loan from an investor to a borrower.
Financial market data in trading economics enable the allocation of capital, the transfer of risk, the determination of prices, and the dissemination of data. Furthermore, it reflects the connections and mutuality of various economic actors and factors. The economic factors include geographical events, economic policies, supply and demand dynamics, and opinions of investors.
2. Economic Indicators
The economic indicators feature shows data about the current state and direction of the economy. It helps users to understand the overall health of a country’s economy. The data of the country’s economy is made of these measures.
- Measures of Output: lnclude (GDP) Gross Domestic Product, show the total value of goods and services produced in a country.
- Measures of Inflation: Consists of CPI: Consumer Price Index, which tracks the changes in the value of a basket of goods and services.
- Measure of Employment: Includes unemployment rate shows the percentage of the labor force that is actively looking for work.
- Measure of Confidence: Includes consumer confidence index that shows the degree of optimism or pessimism that consumers have about the economic situation.
- Measure of Production: It includes a production index that shows the level of activity in the manufacturing, mining, and utility sectors.
3. News and Forecasts
Trading economics also offers news and forecasts based on analysis of historical data and current economic events and trends all over the world. You can access the articles, reports, and charts that offer insights into the global economy. It helps the users to stay up-to-date about developments in the global economy and the financial markets for trading.
4. Events Calendar
The platform highlights the important economic events in the calendar section. This feature offers a near real-time time, most complete, and accurate economic calendar updated 24 hours a day on the World Wide Web. The website claims that the actual values of the calendar are based on official sources, not third-party data providers.
Moreover, previous values are accessible before an economic indicator is reported and marked as reviewed accordingly. Analysis consensus figures show the average forecast among a representative group of economists. The platform also offers forecasts that are driven by analyst expectations and technically anticipated via an exclusive model.
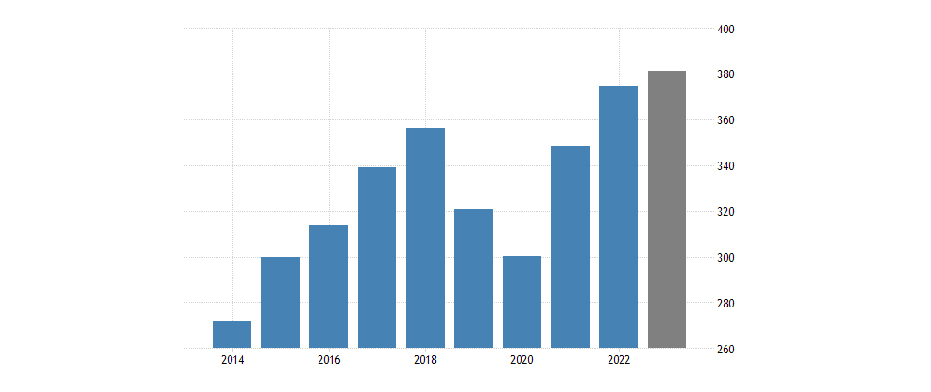
5. Charts and Graph
The trading economics platform caters to interactive financial charts and graphs to view economic data and market trends. The chart and graphs help a trader monitor various performance metrics in areas like budgets, expenses liquidity, cash flow, and others. With these financial charts, traders and investors can magnificently manage risks to confirm strong finances and stable progress.
6. Customizable Alerts
This platform also features customizable alerts to get on-the-spot reports when they get released by mail and SMS for economic indicators. The customizable alert feature lets a user set up alerts that display specific economic indicators that are most relevant to them.
Moreover, users can select specific countries’ indicators for price targets, market movements, and record highs or lows in currencies, stocks, bonds, commodities, and periods to make a personalized view of the market conditions in trading economics. All make helps a user to stay up to date on changes that may affect their trading investment.
7. API Access
The API (Application Programming Interface) feature of this platform caters to direct access to the market data. However, users can download millions of rows of historical data to interrogate the real-time economic indicators and calendar for 196 regions and to subscribe to updates.
It provides several request methods to query the database with the available samples in different programming languages to export the data in XML, CSV, and JSON format. Users can use the API to feed a custom-developed application, a public website, or run-of-the-mill software like Microsoft Excel. But keep in mind that you have to subscribe to the subscription plan to trading economics to get the feature.

